Stop drawing random lines. Learn how real traders identify the levels that actually matter.
Introduction: Most Traders Get S/R Completely Wrong
Support & Resistance is one of the most repeated concepts in trading — and one of the least understood.
Most traders:
- draw 10+ lines everywhere
- pull random levels from every timeframe
- treat every small swing as “support”
- get trapped by fake breakouts
- ignore context
- enter just because price “touched a line”
This is not professional trading.
Support & Resistance, when used correctly, gives you:
- clean entries
- clear invalidations
- real trend context
- trap identification
- high-probability continuation or reversal points
This is the professional approach — direct, clean, and context-driven.
What Support & Resistance REALLY Is
Support is where buyers previously dominated.
Resistance is where sellers previously took control.
But the key is this:
- These levels are not lines.
- They are zones, areas where decisions were made.
- Only strong reactions matter.
Support & Resistance is not about touching a line.
It’s about identifying where the market cared.
This requires filtering — not drawing lines everywhere.
The 3 Types of S/R Levels That Actually Matter
Professionals use only these three:
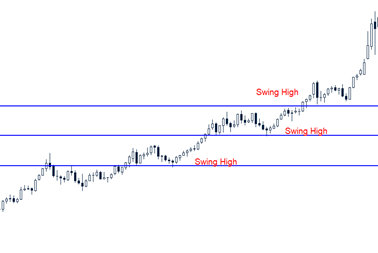
A. Major Swing Highs & Lows (High-Value Levels)
The most important S/R on any chart.
Characteristics:
- strong reaction
- clear rejection
- obvious turning point
- visible on higher timeframes
- used by institutions
These levels create the structure of the market.
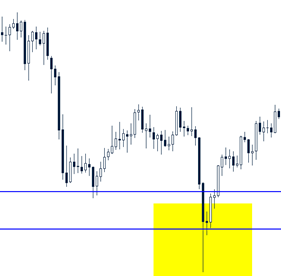
B. Breakout Zones (Former S/R Flipped)
When support breaks → it becomes resistance.
When resistance breaks → it becomes support.
This is where:
- breakout traders enter
- trapped traders panic
- retests give clean entries
This is the foundation of the Breakout–Pullback (BOPB) setup.
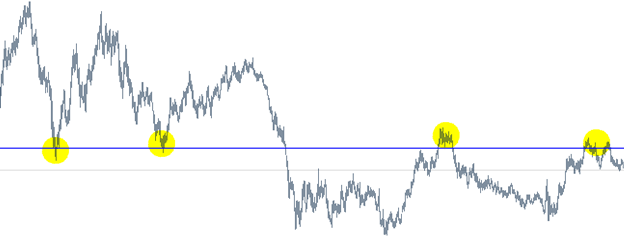
C. Liquidity Levels (Wicks, Stop Hunts)
These are underrated and extremely powerful.
Characteristics:
- long wicks
- fast rejections
- fake breakouts
- stop runs
These levels show where traders are trapped — gold LOVES these.
Example: price breaks below support, forms a long upper wick, then closes back inside the zone — that is trapped breakout liquidity.
How to Mark Support & Resistance — The Clean Method
Professionals use a 3-step filter:
Step 1 — Mark only the obvious levels
If you need to zoom in, change timeframe, or squint →
it’s NOT a real level.
If it’s not obvious → ignore it.
Step 2 — Identify the “reaction strength”
Strong reactions = strong level.
Weak reactions = noise.
Ask:
- Did price bounce hard?
- Did momentum shift instantly?
- Did multiple traders get trapped?
This determines the weight of the level.
Step 3 — Draw zones, not lines
Never draw a single horizontal line.
Use zones that cover:
- wick + body area
- where traders reacted
- where volume happened (if available)
A level is an area of interest, not a pixel.
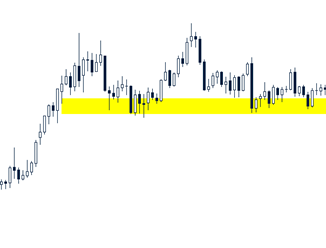
Support & Resistance Are Zones, Not Lines.
Multi-Timeframe Support & Resistance — The Smart Way
Here’s the hierarchy:
- Weekly = major zones
- Daily = high-probability zones
- 4H or 1H = precision entry zones
The mistake:
traders use intraday levels without context.
The correct way:
- Mark weekly major zones
- Mark daily reaction zones
- Use 4H/1H only for execution
- Ignore everything lower unless scalping
This removes 90% of noise and confusion.
How Support & Resistance Behave in Trends
This is where traders get trapped.
In an uptrend:
- resistance breaks
- becomes support
- pullbacks bounce on new structure
- failed breaks trap sellers
Correct behavior:
Buy pullbacks into support.
In a downtrend:
- support breaks
- becomes resistance
- rallies fail at new structure
- failed upside breaks trap buyers
Correct behavior:
Sell rallies into resistance.
Support & Resistance in Ranges — The Trap Zone
Ranges are defined by:
- equal highs
- equal lows
- fake breaks
In a range:
- S/R is extremely active
- false breakouts are common
- mid-range is dangerous
- trend setups fail
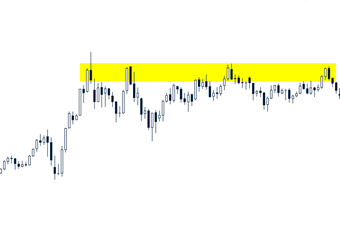
Professionals avoid the middle of the range and wait for:
- range high → look for shorts
- range low → look for longs
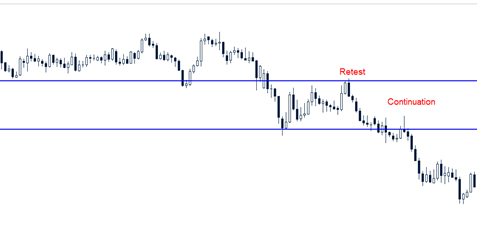
- breakout → retest → continuation
This is discipline — not prediction.
Breakouts and Failed Breakouts — Where the Real Moves Happen
Breakouts fail more often than they succeed.
Why?
Because:
- retail buys breakouts
- professionals fade them
- liquidity sits above/under the range
- smart money takes the opposite side
A failed breakout at S/R = explosive move.
Signs of a fake breakout:
- big wick
- no follow-through
- reversal bar
- fast rejection
- trap pattern
This is where major reversals begin.
Support & Resistance and Stops — Perfect Alignment
S/R gives clean:
- entries
- stop placements
- profit targets
Rules:
Place stops outside the zone
NOT inside the noise.
Target the next major level
NOT random RR numbers.
If price slices through a level like butter → level is weak
Don’t trade it.